
Peer Review Comments
- Joani Radhima
- Mar 31, 2021
- 5 min read

1 // Joani Radhima @ REFRAME: REvieweing Female powerful AsseMbliEs (Group 14)
(I cannot access the Miro board at the moment)
First, let me comment positively about the interesting choice of topic, which is something that is worth the time invested and can lead to some interesting and valuable conclusions. Congrats on that part.
About the data and visualization process itself, I must first admit that I am not sure if the “Categorical” variables mentioned in the blog are ordinal or nominal; the following comments will assume that the data can be ordered (ordinal). There are things I liked and things I have questions about, nothing I did not actually like though.
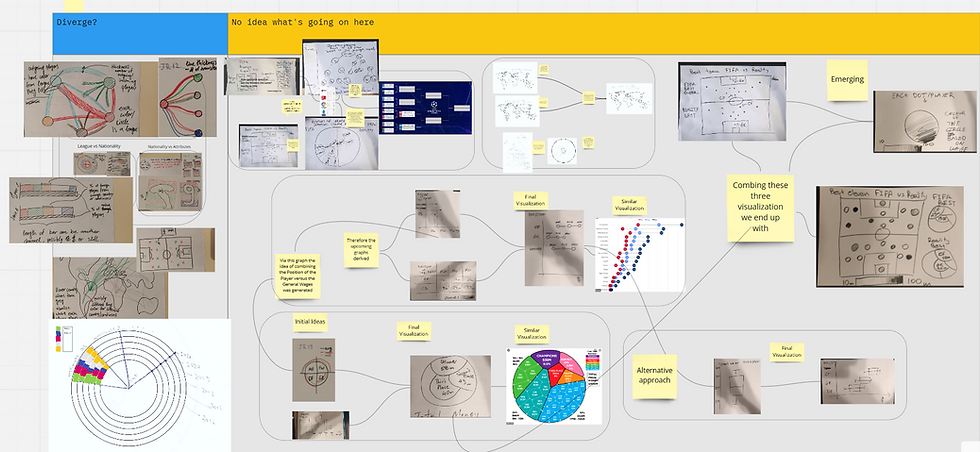
Beginning with the things I liked, let me begin with the image after the gif with Sarah Jessica Parker, with a corresponding question of “How have laws evolved over the past fifty years toward greater gender equality?”. I quite liked the upper middle visualization that looks like multiple flowers with colored petals. The inclusion of time can lead to a beautiful visualization, although some information if you choose to show one flower per decade instead of per year. However, I do not expect there to be much difference year-to-year so that should be fine. Continuing, I will say that I like most of the visualizations of this section, however I feel the bottom-right one (they look like spider-charts) is the same as the one with the flowers but worse / less interesting. I personally found the bottom-left to be nice and detailed as well. Last, the concentric time series graph in the bottom-middle of the section seems very interesting but I feel it might lead to problems with scaling, due to regions closer to the center being less visible than ones on the outer rings.
About the things I did not like as much, as already stated there hardly were any. That said, I must mention that many of these visualizations seem statistically minded and things we have mostly seen before (bar-charts, line-charts, pie-charts, etc). I personally have no problem with this, however the feeling I get from the professors is that they are not looking for statistical graphs and methods (for example EFA and biplots, or clustering and gaussian mixture models) but rather visually pleasing and informative views on the raw data itself. Just something to keep in mind and possibly further check. Finally, there was a 3D plot somewhere in the “diverge 1 – generate raw material” section (3rd row, 2nd plot) and as far as I know 3D is something to avoid.
That is all for now, best of luck going forward!
2 // Michail Athanasiadis @ Urban Outlook (Group 26)
Greeting, folks! First and foremost, I would like to mention that you picked a very interesting topic, that will be inspiring for me in case of a similar analysis!
Furthermore, I'd like to notice that the preliminary visuals in your first blog post of GDP vs Population and the HDI vs urbanization rate are quite insightful. Some suggestions that you might find interesting are:
1) Since you have countries you can use that info and put your results on a map. Maybe, then you could color them based on the GDP or HDI, etc.
2) Moreover, your data consist of details about the general population statistics gathered from 1990 to 2019. Therefore, time series visualization might be an interest for you to further explore. Also, you may find useful the visualization in this link: https://public.tableau.com/en-us/gallery/googles-2020-year-search?tab=viz-of-the-day&type=viz-of-the-day 3) Another very interesting visualization of GDP can be found here https://www.visualcapitalist.com/the-88-trillion-world-economy-in-one-chart/We are currently trying to do something similar with our football data. However, I believe that this graphs suits better in your case.
Hope you find these suggestions interesting!
Good luck with your project!
3 // Tryfon Michalopoulos @ EnergyDB (Group 20)
This is a review for the blog of the 20th team that can be found in the link “https://energydb.medium.com/”. In general, it feels like the team “energydb” did a great in letting anyone that visits their blog, either having knowledge over the domain of Energy Consumption or not, to become familiar with the subject. Also, the topic chosen is admittedly really interesting and as a professional civil and structural engineer i gotta admit that this aspect of the construction procedure is considered as the less important one and is most of the time overlooked (in southern europe at least) and it is great to see that awareness is being raised in the subject.
What i ‘d change:
As a general note, one thing that i noticed while going over this team’s blog is that they avoided putting in technical details (and the reason probably is that this way the blog has higher scientific outreach), but it would make sense, for me at least, to know the exact measurement units of the core feature “Energy Use Intensity” is being output; i personally had to do some googling to find out what the units for this dataset provided by BPD are, since i couldn't access the link provided by the blog without having an account for “https://bpd.lbl.gov/”.
Concerning a statement made in one of the posts which basically stated that “the construction year and the building type are the most important variables”, i would expect that the location of a building would be equally valuable. Especially for the case of the US, where both the latitude and longitude vary a lot.
To be honest, there is not much I would change if any; energydb's members have done a great job in building up their ideas from the ground up and finally coming up in the converge phase with great ideas of visualizing the data with interesting new graphs.
What i ‘d keep:
Clearly, the most informative visualization that this team presented was the heatmap-like graph denoted as “Emerge 3” in the “Exploring the Design Space - Our Initial Ideas” post. The reason is that the two features used “Location” and “Year” basically summarise most of the variability in the data. Let’s take for instance, the “Year” variable which includes latent factors that i would call “Frameworks used in the different construction stages” and “Building materials used” that are highly dependent on the time point a building was built; which consequently highly affect the EUI of the building.
Another visualization that I ‘m fuge fan of and I would certainly include in the project would be the polar chart; the last one presented in the same post. This graph is equally informative, since it includes important features and is easy to read and understand.
I'm looking forward to seeing what these guys come up with next and how they implement all their interesting ideas.


Comments