Not much but it's honest work!
- tryfonmichalopoulo
- Apr 22, 2021
- 3 min read
1) Mike's update
Our progress in order to answer the research question :
"Is the Ultimate Team of 2020 different in reality vs the FIFA 20?".
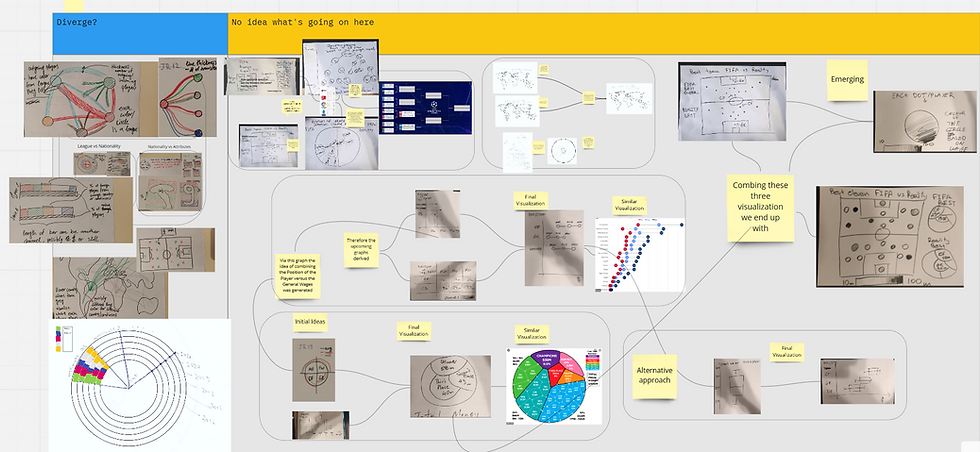
Our goal is to create a football pitch, where the best footballers on the corresponding position will be depicted. On one side the ones that derived from UEFA and on the other side the best eleven based on the FIFA's overall.
Already completed:
Using the Svelte,
The formation of the football pitch.
The background.
Two sample players.
To be done:
Firstly, our next improvement will be to upload in Svelte the CSV file of the FIFA 20 as a separate JS file in order to select the best eleven players on each position.
Secondly, another idea that we are going to apply is, when the mouse is over one player's photo the corresponding Stats Cards will appear.
Finally, checking the adjustment of the frame.

2) Tryfon's update
Not sure if this type of graph formally exists, but it feels like a cool idea to just give an overview of the data concerning the developement over time for each "cluster" -in our case the leagues- in a set of few attributes.
More precisely, we ve split the circle into 5 parts, each one of which refers to the five most important attributes; the ones that we found that are the most correlated with the overall attribute and basically act as aggregations to different sets of the other somewhat around 100 or sth attributes in our dataset which are "pace", "shooting", "passing", "dribbling" and "defending". Having a limited number of attributes, less than 10 or so, is essential so as to not end up with a dense graph of random colours that are really make no sense. Same goes for the number of the leagues, which were chosen to be limited to the 5 most "important" ones, namely "English Premier League", "Spain Primera Division", "Italian Serie A", "German Bundesliga" and "French Ligue 1". Finally, we see that going from the center to the perimeter of the circle there are some discrete layers, seven in the number, each of which corresponds to a different year, starting from 2015 up to 2021.
How to read this!?
The way i thought that this work, was that one could basically focus on one league/colour and get an idea of how the quality of that particular league changes over time with regard to an attribute (or more) as compared(!) with the rest of the leagues.
There were however a few complications with this, the most important of which was that the end result was literally showing what is presented on the right side of the figure below. We initially tried to normalize the mean for each league and attribute such that they sum up to one, so that it could directly be used as the proportion of the of the corresponing 2*PI/5 angle on the graph. As u could imagine, that proportion was equal to a value around 0.2 and those subtle differences in the normalized values could of course not be spotted on the graph. Things got a little bit better, when we, instead of using the mean, we tried out a few quantiles of the data, and if i remember correctly the top 20% would give us the best results (highest discriminant power), but were still not adequate. Two options were put on the table: first one was to apply LDA (Linear Discriminant Analysis) or Isolation Trees (or any other baggin procedure) that could in fact show us the best features to use in order to have the highest variation on the plotted data and second was to map the mvalue for each of the leagues arbitrarily on the values 45%, 25%, 15%, 10% and 5%. The chose to go with the second option, which unfortunately led to the data being missrepresented in the graph and this is actually the reason why we should emphasize the phrase "as compared".
As a side note, the data has been processed on python, imported into js scripts and vanilla d3 has been used, and the corresponding files can be found in the following links.

python code (preprocessing): https://github.com/Tryfonm/my_website/blob/master/fifa_load_data.ipynb
the building block of my vision:
3) Johny's update


Comments